The net effective median rent (face rent minus landlord concessions) surged +33.4% year over year to $4,100, exceeding the $4,000 threshold for the first time and reaching a new high for the seventh consecutive month. While the net effective average rent, up +31.5%, reached $5,051, exceeding the $5,000 threshold for the first time ever.
As a result, the market share of landlord concessions fell to 12.8%, down -26.3% from the same period last year, the lowest level in nearly six years.
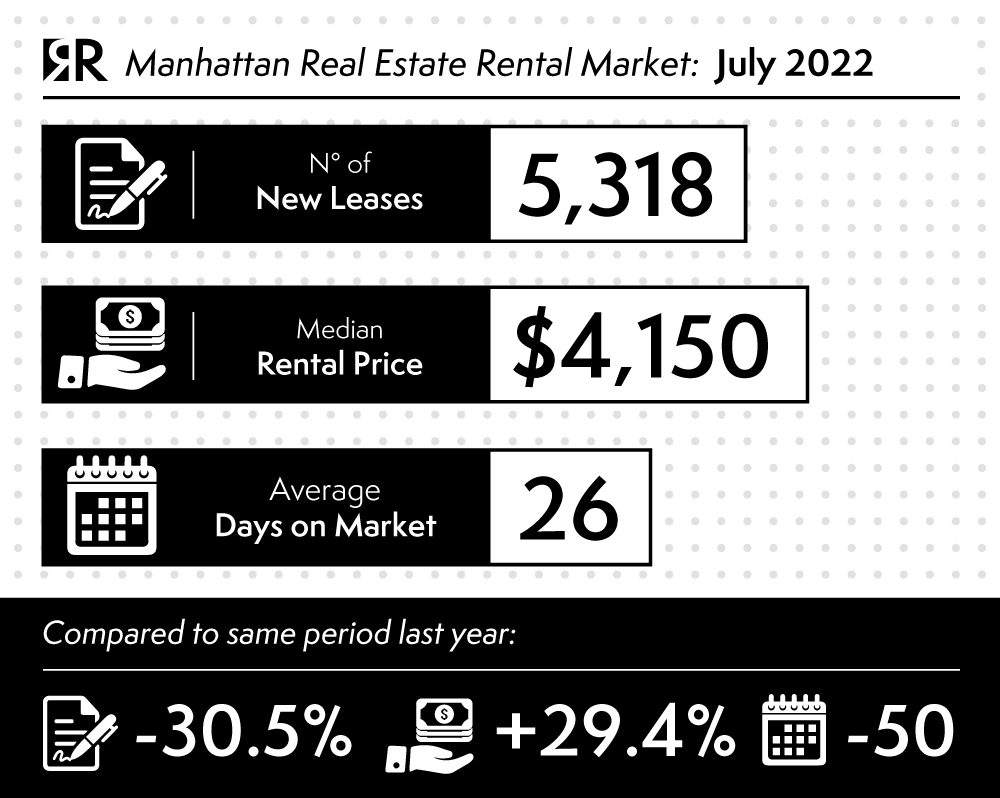
New signed leases expanded month over month for the fifth straight time to 5,318 but were still down 30% from July 2021.
Another good metric to look at is the market share for two-year leases, which reached its highest level since last November, a sign that shows how tenants are concerned about possible new price gains in the following months.
Listing inventory is down -43.5% year over year and the vacancy rate fell to 2.08% (from 6.07% in July 2021).
The sales market is becoming more and more appealing, quarter after quarter.
Further data to be considered:
Highs and records even for those metrics that don’t include concessions. The median rent reached a new high for the sixth straight month marking +29.4% at $4,150 as average rent rose to a new record for the third, with an increase of +27.5% year over year at $5.113.
The average per square foot rent was $81,24, up +19.9% from the same period last year.
The days on market, at 26, were 50 less than a year ago and 24 from the previous month.
Data pulled by the listing inventory, which is down by -43.5% year over year, with 6,669 properties on the market.
(data source: millersamuel.com)
ShareAUG
2022


