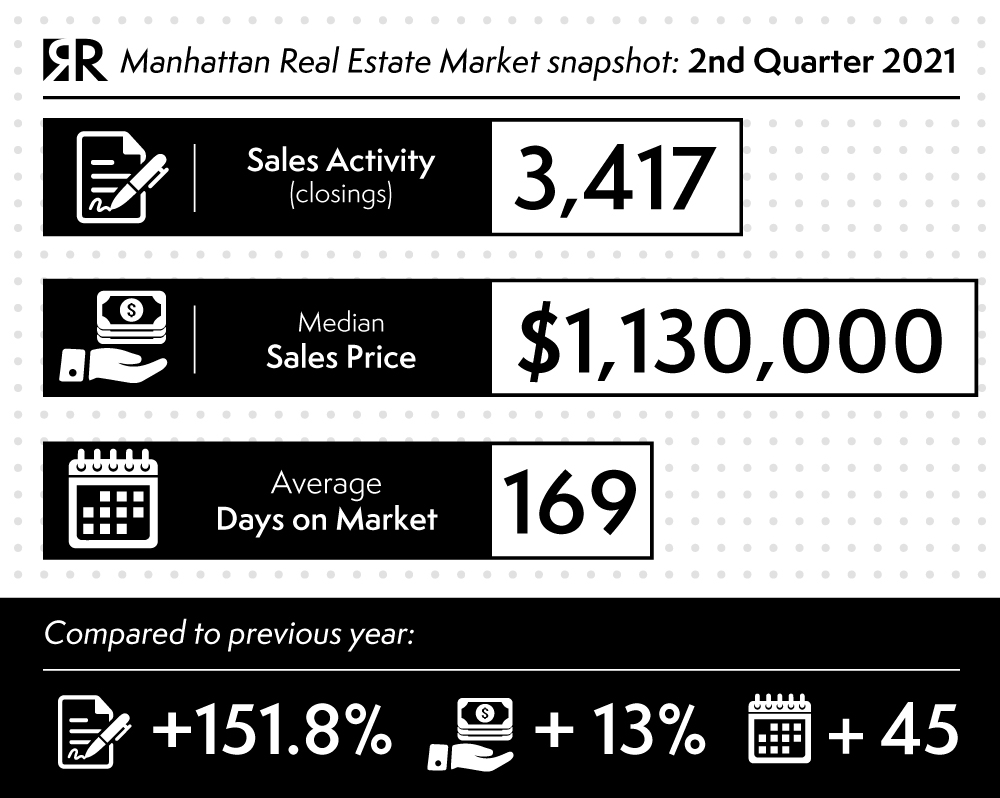
The Manhattan real estate market is experiencing a period of significant recovery. Although the inventory is still substantial, sales activity has exploded and the “covid discount” effect is already disappearing. It should be remembered that these data are somehow still influenced by the pandemic as they reflect the difference between this quarter and the same period last year.
Talking by Numbers. Let’s try to put things in perspective:
There were 3,417 closed sales, up +151.8% from the year-ago quarter. The most significant jump in sales activity since tracking the metric began in 1990, a very encouraging signal and an indication of newfound market confidence.
The median sales price, up 13% YoY to $1,130,000, is at the highest level of the last two years. At the same time, the average sales price is up 2,1% at $1,921,204. Numbers were slightly skewed by the tendency to buy more spacious properties during last year’s lockdown.
The average price per square foot was $1,548, down -5.7% from $1,642 of 12 months ago. This is a sign that opportunities are still there.
Now let’s analyze an interesting fact, during this quarter the resales comprised 90% of all sales, and their average price per square foot declined -3.6%, which is a reasonable proxy for a “COVID discount” range of 3% to 5%. However, in the first quarter, this metric fell -9% for a range of 7% to 10% suggesting the discount window during the pandemic era is compressing.
With the number of sales rising faster than listing inventory, the pace of the market speeds up with months of supply rate fell – 50% from the prior-year quarter to 6.9 months, while days on the market was 169, 36.3% longer than the previous year as the market has absorbed older inventory.
Other signals of a market more and more in line with the usual business in Manhattan are:
Listing discount, the percentage difference between the list price at the time of sale and the sales price, was 6.4%, down from the 7.9% listing discount in the year-ago quarter.
The market share of cash sales recovered from the prior quarter seven-year low of 39.3% to 45.7%, consistent with the 46% share in the first quarter of 2020 that ended in the lockdown.
Finally, the market share of bidding wars, defined as properties sold above the last listing price, was 6.8%, up from the 3% seven-year low in the prior quarter and sharply below the 31% record set in the third quarter of 2015.
(source: millersamuel.com)
ShareJUL
2021


