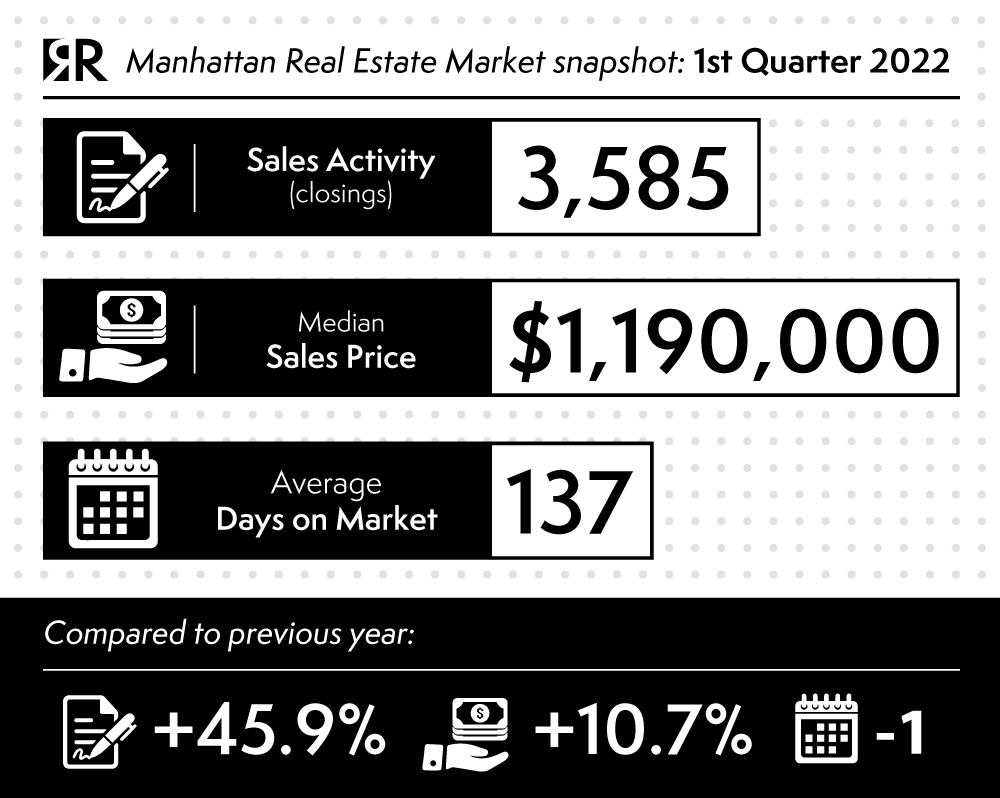
We reached a record-breaking number of closed sales, 3,585 to be exact, the highest registered in thirty-three years; up +45.9% year over year and +48.9% from pre-pandemic levels.
Listing inventory (the number of available properties on the market) declined 4.4% to 6,906. A decline that has been going on for several quarters. As the market returned to seasonality, the excess demand overpowering listing inventory was partially offset by the seasonal rise in supply.
Sales kept rising and listing inventory kept decreasing from the year-ago quarter. As a result, the months of supply (the metric that indicates the market’s pace) was at 5.8 months, 34.1% faster than the prior-year quarter, and 23.7% faster than the same period two years ago before the pandemic.
The median sales price of a Manhattan home increased +10.7% year over year to $1,190,000, the second-highest level on record, while the average sales price surged +19.3% to $2,042,113. The average price per square foot increased +16.5% to $1,616 from a year ago.
All these indicators are above pre-pandemic levels.
Days on market was 137, 0.7% less than the previous year. However, listings that required no listing price adjustment were sold within 79 days. While listing discount was 4.7%, up nominally from the 4.6% listing discount in the year-ago quarter.
The market share of bidding wars rose for the fourth straight quarter to the highest level in four years.
We can see how the residential market is recovering not only compared to the pandemic period but also compared to the pre-pandemic situation. But let’s not forget that pre-pandemic levels were already weakened by a few years of relatively softer markets; therefore we still have ways to go in order to see substantial appreciation from the previous peaks of 2015-2016.
(data source: Miller Samuel Inc.)
ShareAPR
2022


