

This quarter (Jul-Aug-Sep) began just over a week after the COVID lockdown ended and it reflects sales-contracts that were signed during and after the COVID lockdown. We notice a slight improvement: the number of closed sales edged up a bit from the previous quarter which bodes well for the future..or at least we hope so.
Some Stats:
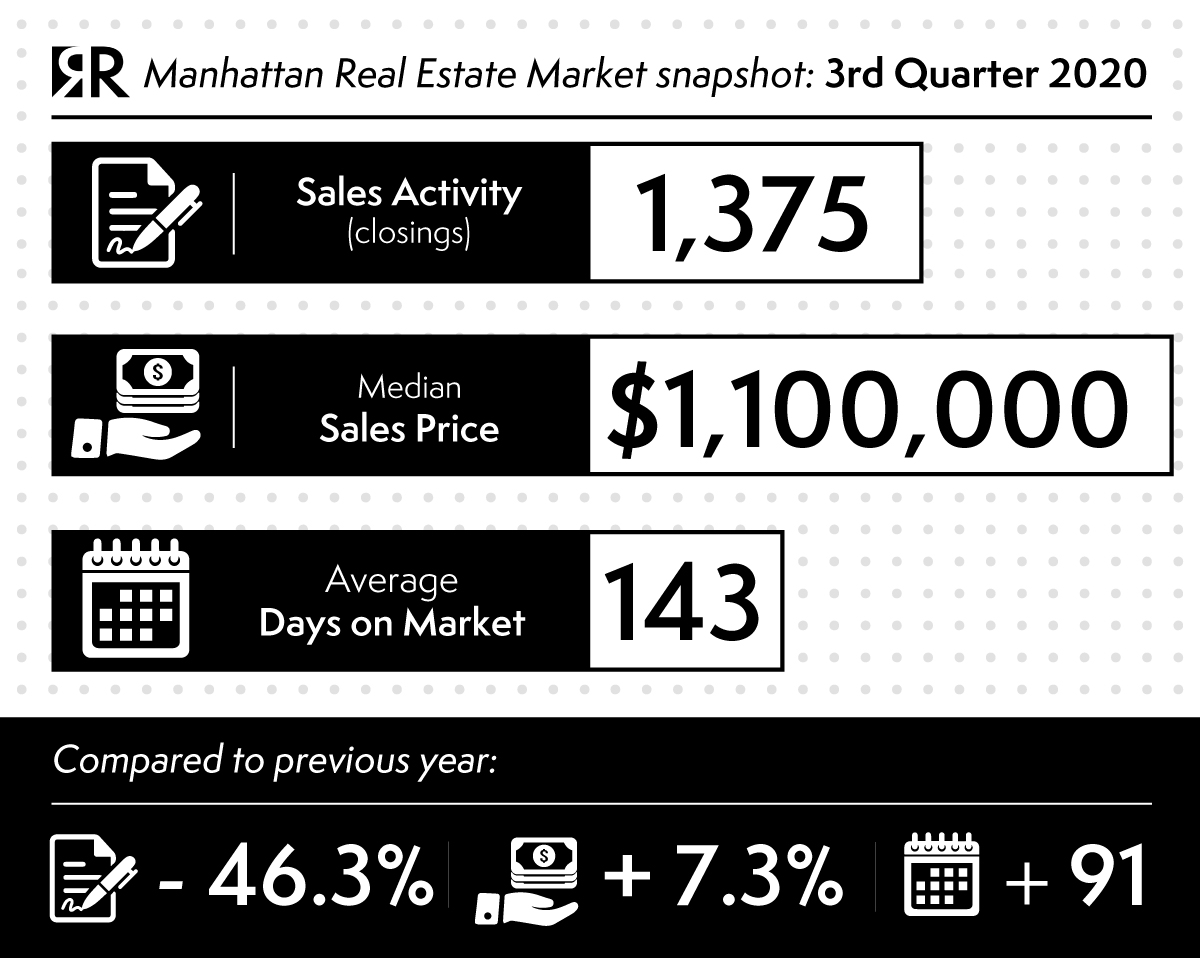
The number of sales fell 46.3% to 1,375 from the same period last year, the second most significant year over year decline in eleven years after the previous quarter decline of 54.1%. (Over the past decade, third-quarter sales averaged 3,015 or roughly double the current quarter result.)
In a change from the prior quarter pattern, sales above the $5 million did better than the market average.
The starter markets’ softening activity ended up skewing the average square footage of a Manhattan apartment sale upward by 30.9% to 1,423 square feet. As a result, the average sales price and the median sales price were skewed 31.6% and 7.3%, higher respectively, with the average sales price that returned above the $2 million threshold while themedian sales price rose to $1,100,000. The average price per square foot saw a nominal uptick of 0.5%.
These price increases reflected a shift in the mix of what was sold and do not represent a housing market with rising prices. So don’t be deceived!
Listing inventory rose to 9,319 units. Consider that the record was reached in the first quarter of 2009 at 10,445.
New development listing inventory that is not placed on the market is referred to as “shadow” and is not part of these totals because they are not available for sale.
The months of supply, the number of months needed to sell all listings at the current sales rate, was 20.3 – a speed that is less than half of the year-ago pace of 8.6 months. The slowest pace on record was 26.2 months, set in the first quarter of 2009 during the financial crisis. So, from this perspective, we are currently faring better than during the Great Recession.
The days on market, the average number of days from the last listing date to contract date that closed during the quarter, was 143 days, the longest marketing time since 2012. Marketing time expanded 57.1% over the past year. Which is not surprising given we had to deal with a complete lockdown!
Listing discount, the percentage difference between the list price at the time of sale and the sales price continued to show the most negotiability in a decade, rising to an eleven-year high of 8.9% from 5.1% in the prior-year quarter. The rise in negotiability is consistent with the increase in listing inventory and the decline in sales.
The overall Manhattan market share of bidding wars (YES we still had those) was 3.6%, the lowest level in more than eleven years, and well below the 31% average of five years ago.
ShareOCT
2020