

Sales are still slowing down but at a lower rate. And this could imply that the trend might be turning around in the near future. We as brokers have experienced a busy month of December and we are starting to get more optimistic for 2020.
So here is the data:
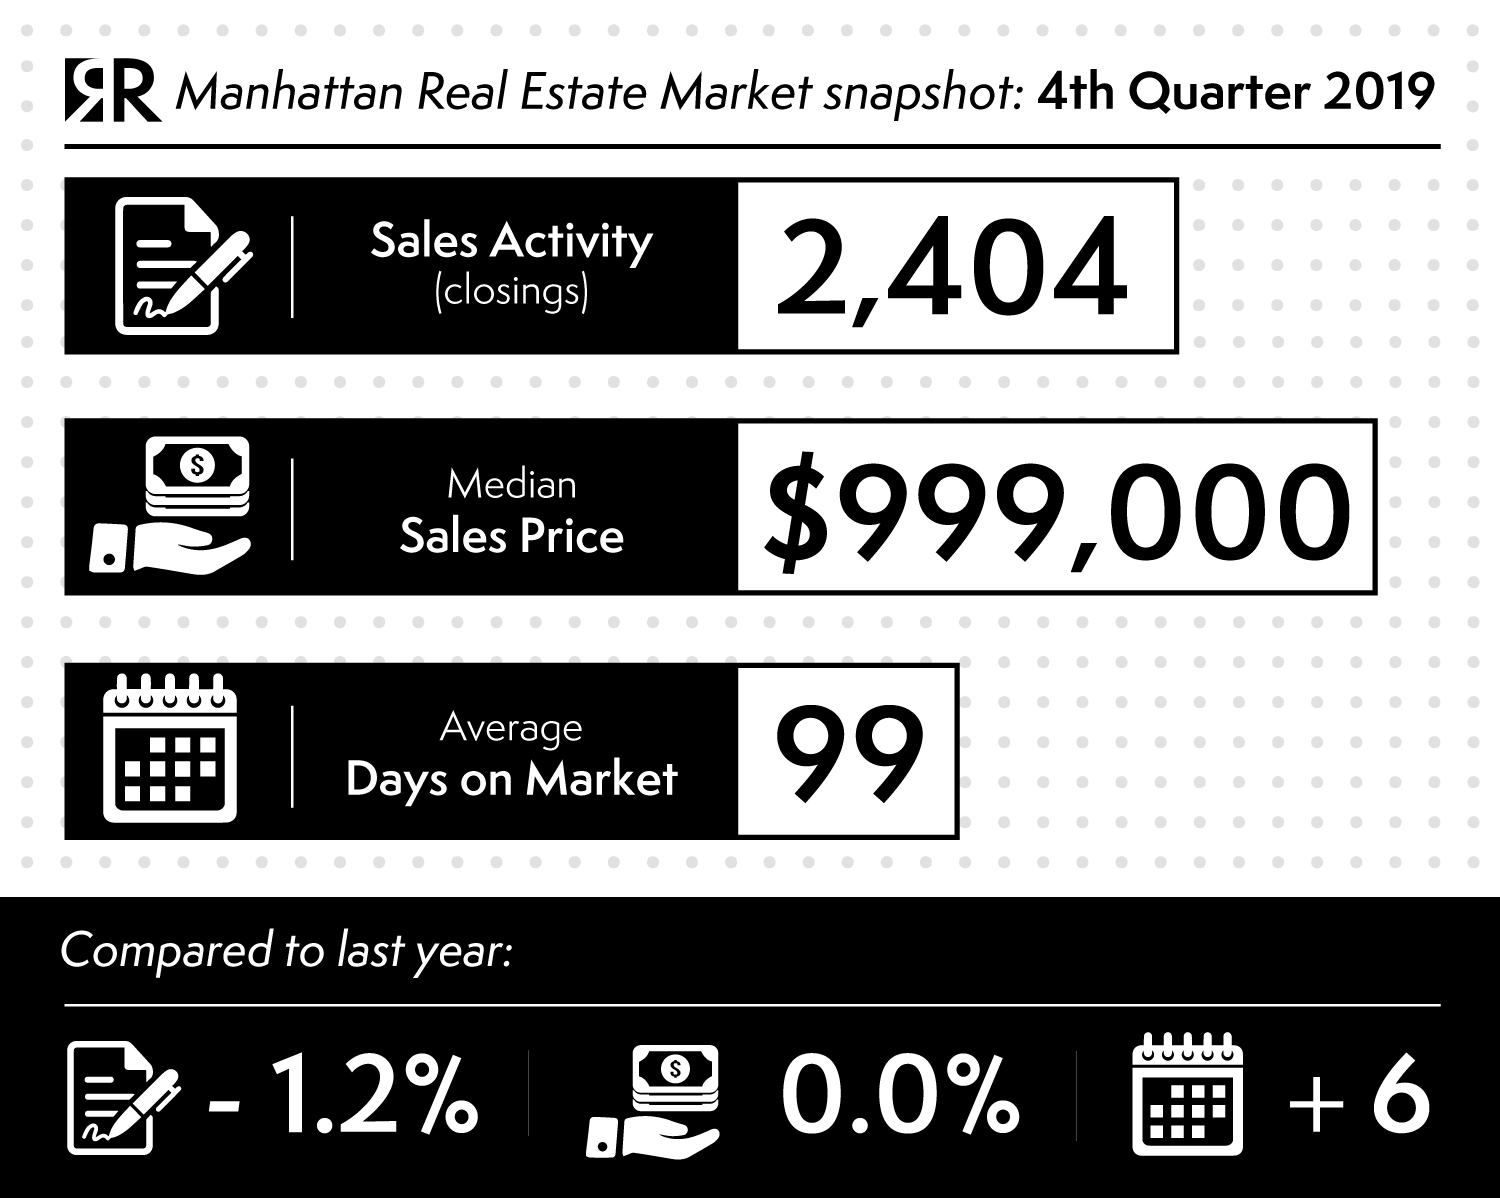
The number of sales year over year declined by 1.2% in the 4th quarter of 2019 to 2,404 compared to the same quarter the year prior.
However, the number of sales below the $5 million threshold actually rose 1.6% over the same period. Most of the decline in activity occurred above the $5 million price point with sales falling 37.6% since the last quarter of 2018 (before the introduction of the new rent law and Mansion tax in New York State on top of the SALT tax introduced in the prior year).
Median sales price slipped back below the $1 million threshold to $999,000 in the fourth quarter, similar to the fourth quarter of 2018 and was only the second time median sales price fell below $1M in four years.
Because most of the decline in activity occurred at the top of the market, the average sales price decreased 7.5% to $1,815,700. And the average price per square foot decreased 6.1% to $1,581 respectively over the same period.
Days on market, the average number of days it takes to sell all the apartments that closed during the quarter, slowed by 6 days to 99 days from the year-ago quarter.
Listing discount, the percentage difference between the list price at the time of sale and the sales price, eased slightly to 6.8% from 6.2% in the prior-year quarter.
The market share of sales that entered a bidding war, sold above the last asking price, was 6% down from 7% in the prior-year quarter. This is a historically low level for Manhattan.
Overall listing inventory rose 9% to 6,643 from the prior-year quarter, the highest fourth-quarter total in eight years. Therefore: a lot of goodies to choose from for the savvy buyer!
The months of supply, the number of months to sell all active listing inventory at the current rate of sales, slowed 10.7% year over year to 8.3 months, consistent with the long-term average.
So far we have been talking about metrics regarding closed sales..and we know that it takes a few months for a transaction to close in NYC, therefore these indicators are lagging a little bit.
As I was mentioning at the beginning..we had a busy month of December. Overall the contract activity was up a juicy 15.5% in December compared to the previous year. This is the most significant piece of data at the moment.
Buyers and sellers are finding an agreement more and more often…and it looks like the market is picking up. Is this trend gonna last? We shall see.
(source: Miller Samuel Inc.)
ShareJAN
2020