

Let’s take a look at closed sales in the first quarter of 2021.
Manhattan has finally joined the real estate party that the wider tri-state region, and also most markets in the USA, have been experiencing since the summer.
Manhattan lost more residents than the other boroughs during the pandemic due to its greater wealth and mobility. But the borough has come back, with demand fueled by record-low mortgage rates, greater affordability, pent-up demand, and an improved sense of safety with the deployment of the COVID-19 vaccines.
Talking by Numbers. Let’s try to put things in perspective.
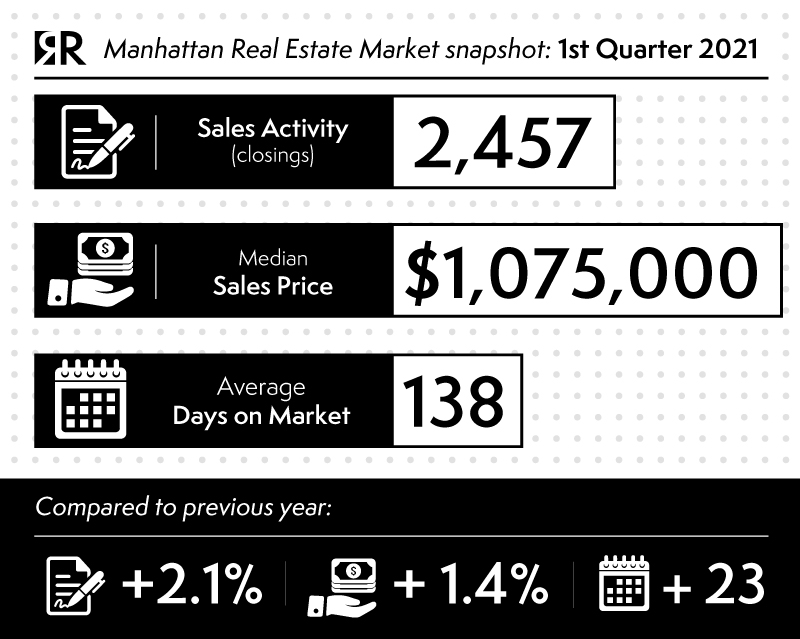
There were 2,457 closed sales, up +2.1% from the yearago quarter, slightly below the 2,567 average for the first quarter over the last decade. This first-quarter sales exceeded year-ago levels for the first time after three consecutive quarters of meaningful annual declines. Sales surged +28.7% from the last quarter of 2020.
The overall price trend indicators continued to show mixed results, the median sales price was $1,075,000 up +1.4% YoY while average sales price was $1,711,159 down -9.4% from $ 1,887,740 for the same period last year.
The average price per square foot declined -9.9% year over year to $1,387, and the lowest level reached in six years.
Although listing inventory was 7,224, or 18.2% higher than the year-ago quarter, the supply of listings for sale dropped -22.5% from the third quarter. The market is absorbing inventory quickly.
The days on market was 138, 20% longer than the previous year. Properties sold that were correctly priced – not needing a price adjustment – sold in half the time or 85 days faster.
Listing discount, the percentage difference between the list price at the time of sale and the sales price was 4.6%, down from the 7.2% listing discount in the year-ago quarter.
First-time buyers set a seven-year market share record of 41.9%.
(source: millersamuel.com)
Share
APR
2021